
Product profitability analysis measures the net profit each product generates after subtracting every cost directly tied to producing, selling, and delivering it. That sounds straightforward, but most businesses are surprised by what they find when they actually run the numbers. Research across ecommerce brands found that a large portion of SKUs were unprofitable once all variable costs were properly allocated. The catalog looked healthy at the revenue line. It looked very different at the contribution line.
Gross margin alone does not tell you this. It omits fulfillment, returns, marketplace fees, and marketing spend — the costs that often determine whether a product actually makes money. A complete analysis works through two contribution margin layers:
- CM I (Contribution Margin I): Net revenue minus all direct variable costs (materials, fulfillment, fees, shipping). This shows what each unit contributes above the costs it directly causes.
- CM II (Contribution Margin II): CM I minus product-attributable fixed costs (dedicated tooling, product-specific storage, product-level marketing). This reveals whether the product covers its own fixed infrastructure.
The output is not a cost sheet. It is a decision framework for pricing, portfolio rationalization, and resource allocation. Typical costs included: cost of goods sold (COGS), inbound freight and duties, outbound fulfillment, payment processing fees, returns, and attributed advertising spend.
Why product profitability analysis is critical to business success
Revenue growth can hide serious margin problems. A company can increase sales while simultaneously destroying profit, if the products driving that growth carry hidden costs that never surface in top-line reporting. High revenue alone does not guarantee profitability; products with deep discounting or high return rates often drain margin despite strong sales volume.
The business case for running this analysis comes down to a few concrete outcomes:
- Identify true profit drivers. Most portfolios follow a version of the 80/20 pattern: a small share of SKUs generates the vast majority of contribution margin. Knowing which products those are changes where you invest.
- Expose unprofitable SKUs. Products that appear successful by sales rank can be quietly consuming cash through returns, acquisition costs, or discounting. Without SKU-level data, these "bleeders" stay in the catalog indefinitely.
- Fix pricing. Cost-plus pricing built on accounting overhead allocation is systematically distorted. High-volume products absorb more overhead and look less profitable than they are; low-volume products absorb less and look better. Product-level contribution margin corrects this.
- Rationalize the portfolio. Cutting unprofitable SKUs reduces complexity costs across storage, order handling, and inventory management, freeing up cash and operational capacity.
- Improve cash flow. Redirecting inventory investment and ad spend toward products with strong contribution margins produces more cash per dollar deployed.
The indirect cost problem is where most businesses get tripped up. Ignoring complexity overhead — the operational burden each additional SKU adds — means the portfolio looks healthier than it is. Product proliferation adds complexity costs that erode average margin without ever appearing on a standard P&L.
How to calculate product profitability step by step
The calculation is not complicated, but it requires pulling data from sources that rarely talk to each other: your ERP or inventory system, marketplace settlement reports, your ad platform, and your returns data. Here is the sequence.
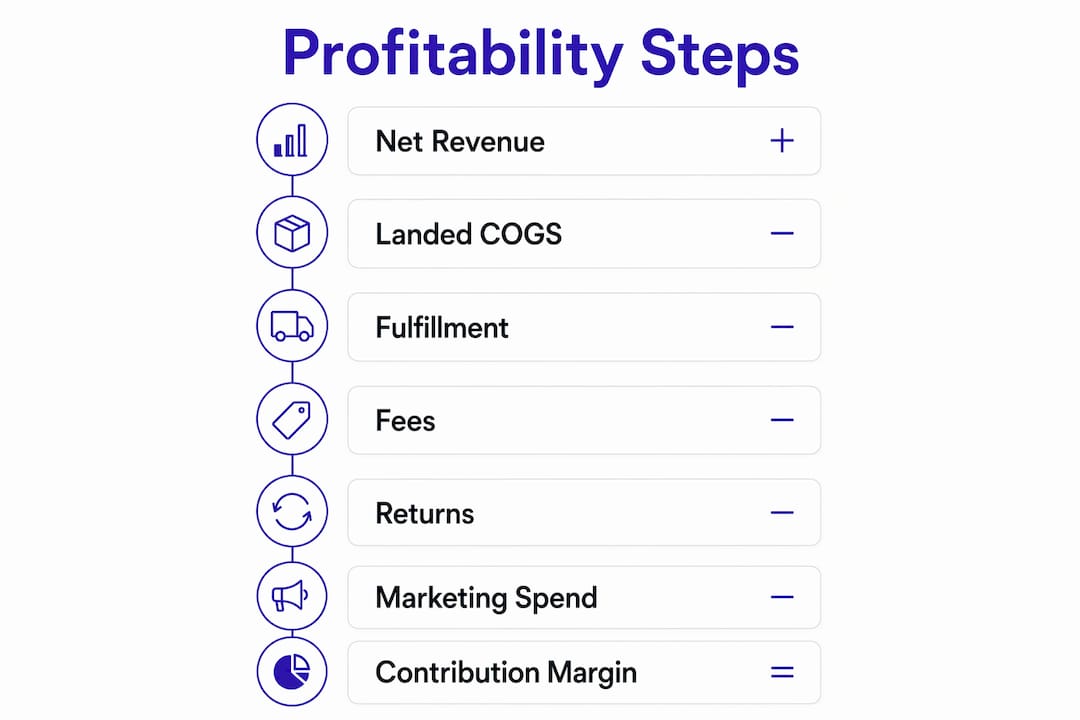
Step 1: Get to net revenue
Start with gross selling price, then subtract discounts, promotional credits, and refunds at the SKU level. The gap between list price and net revenue is itself a diagnostic signal. Products with deep discount waterfalls are candidates for price erosion review.
Step 2: Calculate landed COGS

Landed cost is the supplier unit price plus every cost required to get the product to your warehouse: inbound freight (air or ocean), import duties and customs fees, port handling and brokerage, insurance in transit, and inbound inspection charges. Landed cost is routinely underestimated. For internationally sourced goods, it often runs materially above the base supplier price, and distributing these costs across units by weight or cubic volume gives the most accurate per-SKU figure.
Step 3: Add outbound fulfillment costs
Pick-and-pack fees, packaging materials, carrier base rates, dimensional weight adjustments, fuel surcharges, and residential delivery surcharges all belong here. If you use FBA or a third-party logistics provider, pull these from settlement reports. "Free shipping" is not free — it is a cost that needs to land somewhere in the calculation.
Step 4: Factor in payment processing and marketplace fees
Amazon referral fees vary by category and can materially reduce true net profit when factored into the analysis. Payment processors like Stripe typically charge a percentage plus a flat transaction fee per sale. These need to be tracked per channel, not blended across the catalog, since the same SKU can have very different economics on a direct-to-consumer site versus a marketplace.
Step 5: Allocate returns cost
Returns are the most frequently omitted cost in SKU economics. Calculate your return rate per SKU and multiply by the average cost per return, which includes reverse logistics, inspection and restocking labor, and repackaging. A product with a high return rate can flip from profitable to unprofitable once this cost is properly allocated. Build in a return reserve for anticipated future returns, not just realized ones, to avoid underestimating true cost.
Step 6: Attribute advertising and marketing spend
For each SKU, allocate the ad spend that drove its orders. For Amazon, attribution is relatively clean through advertising reports by ASIN. For paid social, a pooled allocation by product group is a practical alternative. If you spent $2,000 on ads that generated 500 orders for a specific product, that is $4 per order in marketing cost that belongs in the calculation.
Step 7: Calculate CM I and CM II
With all variable costs assembled, the math is:
CM I = Net Revenue per Unit − Variable Costs per Unit (COGS, fulfillment, fees, returns, marketing)
CM II = CM I − Product-Attributable Fixed Costs per Unit (dedicated tooling, product-specific storage, product-level compliance costs)
The table below shows a worked example for a single SKU:
| Cost component | Amount per unit |
|---|---|
| Selling price | — |
| Less: discounts and returns | — |
| Net revenue | — |
| Landed COGS | — |
| Outbound fulfillment | — |
| Marketplace and payment fees | — |
| Returns reserve allocation | — |
| Attributed marketing cost | — |
| CM I (variable margin) | — |
| Product-attributable fixed costs | — |
| CM II (product self-sustainability) | — |
This product has a positive gross margin and even a positive CM I. But once its dedicated fixed costs are included, it is consuming more than it generates. Without the CM II layer, it stays in the catalog indefinitely.
What costs belong in the analysis and what to leave out
Getting the cost boundaries right is where most analyses go wrong. Include the wrong costs and you kill products that are actually fine. Exclude the right ones and you keep products that are quietly bleeding cash.
Direct variable costs (always include):
- Supplier unit cost (COGS)
- Inbound freight, duties, customs fees, and port handling
- Outbound fulfillment, pick-and-pack, and last-mile shipping
- Payment processing fees and marketplace referral fees
- Packaging materials and inserts
Product-attributable fixed costs (include in CM II):
- Dedicated production tooling or molds used only for this product
- Product-specific storage or dedicated warehouse space
- Regulatory compliance costs tied to a specific SKU
- Marketing spend that can be directly attributed to the product
Shared fixed overhead (exclude from SKU-level margin):
- Warehouse rent and utilities
- General headcount and salaries
- Shared software subscriptions
- General administrative costs
The test for whether a fixed cost belongs at the product level: if this SKU were discontinued, would this cost eventually disappear within 6–12 months? If yes, it is attributable. If it remained regardless, it is shared overhead and belongs below CM II in the company P&L, not in the product margin calculation.
Hidden and complex costs to watch:
- Returns and rebates. Return rates vary widely by product category. Allocating returns evenly across the catalog masks which SKUs are actually driving return costs.
- Complexity overhead. Each additional SKU adds storage slots, order handling variations, and inventory management time. This overhead is real but rarely visible in standard reporting.
- Discounting patterns. Frequent promotions to move slow inventory are a cost. If a product only sells when discounted, the discounted price is its real selling price.
Who owns product profitability analysis in your organization
No single team has all the data needed to run this analysis. Finance holds the P&L and cost data. Product managers know the SKU catalog and lifecycle stage. Supply chain owns landed cost and fulfillment data. Marketing controls ad spend attribution. Sales understands channel mix and discount patterns. Getting the analysis right requires all of them.
Here is how responsibilities typically break down:
- Finance and FP&A: Own the methodology, the contribution margin model, and the final output. Responsible for data validation and ensuring cost allocations are consistent across SKUs.
- Product managers: Provide SKU-level context, flag lifecycle stage (growth, mature, declining), and interpret results in the context of product strategy and customer relationships.
- Supply chain: Supply landed cost data including freight, duties, and fulfillment costs. Flag changes in carrier rates or sourcing costs that affect margin.
- Marketing: Provide ad spend attribution by SKU or product group. Responsible for ensuring campaign data maps to the right products.
- Sales: Flag channel-specific pricing, discount structures, and promotional activity that affects net revenue at the SKU level.
Ongoing communication matters as much as the initial analysis. Costs change. Carrier rates shift. Return rates move seasonally. A contribution margin calculation that was accurate in january can be materially wrong by april if no one has updated the inputs. Assign a clear owner for each data source and set a regular cadence for updates.
Real-world examples of product profitability analysis in action
The high-volume bleeder. A consumer goods brand identified its third-best-selling SKU as one of its worst margin contributors. The product had a 35% return rate, required custom packaging, and was heavily promoted to maintain its sales rank. At the gross margin level it looked fine. At CM II, it was negative. The brand discontinued the SKU and reallocated the inventory budget to two products with strong CM I ratios and low return rates. Overall contribution margin improved even though total revenue declined.
The pricing correction. An apparel seller running SKU-level profitability tracking found a product running at 8% contribution margin, primarily because it was priced $4 below comparable items in the market. The product had a loyal repeat-customer base and a low return rate. A $5 price increase moved the contribution margin to 18% with no measurable drop in conversion. The analysis made the case for the increase; without it, the pricing decision would have been made on gut feel.
The portfolio rationalization. A mid-market brand with 400 active SKUs ran a full CM II analysis and found that classifying products by contribution margin tier rather than sales rank changed the resource allocation picture entirely. The top 25% of SKUs by contribution margin were generating the vast majority of total margin. The bottom 30% were collectively generating minimal contribution while adding meaningful complexity cost. Cutting 80 SKUs reduced storage fees, simplified order handling, and freed up working capital for the top performers.
The returns-driven loss. A product appearing successful on sales metrics was consuming excessive cash through high return rates and acquisition costs. Once returns were allocated per SKU rather than spread across the catalog, the product flipped from profitable to unprofitable. The team adjusted the product description and size guide, which reduced the return rate and restored positive contribution margin.
Advanced insights on contribution margin and SKU profitability tiers
The CM I and CM II framework is where product economics get genuinely useful. CM I tells you whether a product covers its variable costs. CM II tells you whether it covers its dedicated fixed infrastructure. A product with positive CM I but negative CM II is not self-sustaining. It is being subsidized by the rest of the portfolio.
Moving beyond gross margin to layered contribution margins exposes hidden profitability drivers and cost sinks that line-level reporting conceals entirely. The practical implication: a product line can look profitable in aggregate while containing individual SKUs with deeply negative CM II. The line average hides the problem.
Product proliferation is a silent margin killer. Each additional SKU adds operational overhead across storage, order handling, and inventory management time, eroding average margin without ever appearing as a line item. A catalog of 400 SKUs is not four times more complex than a catalog of 100. The complexity compounds.
The 80/20 pattern holds consistently across ecommerce portfolios. Research found that a minority of SKUs generated the majority of total contribution margin without specifying exact percentages. Knowing which products those are is the starting point for every portfolio decision.
SKU profitability tiers give you an operating framework beyond the raw numbers:
- Hero (A-tier): High contribution margin, low return rate, adequate inventory coverage. Scale budget and prioritize replenishment.
- Maintain (B-tier): Stable margin, low support risk, not yet a major acquisition driver. Use repeat-customer offers and controlled placement.
- Observe (C-tier): Promising sales signal but unstable return rate, discount depth, or ad cost. Keep small budget, gather evidence, block hero placement.
- Clean Up (D-tier): Negative or near-zero contribution margin with no realistic path to improvement. Discontinue or pause.
Pro Tip: Before discontinuing a low-CM I product, run a customer-product cross-analysis. Some low-margin products serve as entry points that bring customers into the portfolio who then buy high-margin products alongside them. Cutting the entry product may lose the customer entirely. The CM II number is necessary but not always sufficient for the exit decision.
A return reserve is a non-negotiable part of accurate SKU cost calculation. Relying solely on realized returns understates true cost because returns arrive with a delay. Building in a reserve for anticipated returns gives a more accurate picture of what each unit actually costs to sell.
What tools support product profitability analysis
The right tool depends on where your data lives and how many SKUs you are managing.

Spreadsheets (Google Sheets, Microsoft Excel) work for catalogs under 50 SKUs where data sources are limited. The limitation is manual data entry: pulling settlement reports, fee data, and ad spend into a single model is time-consuming and error-prone at scale. Spreadsheets also lack real-time updating, so the analysis is always a snapshot.
ERP systems (NetSuite, SAP, Microsoft Dynamics) contain the cost and inventory data needed for landed COGS and product-attributable fixed costs. Most mid-market ERPs can produce product-level margin reports, but they typically rely on accounting cost allocation rather than contribution margin methodology. The output is useful as a starting point, not as a final profitability view.
Ecommerce analytics platforms consolidate sales, fees, and fulfillment data across channels. The best ones pull settlement data directly from Amazon Seller Central, Shopify, Walmart Seller Center, and eBay, then map fees to individual SKUs. This eliminates the manual step of parsing settlement reports and reduces the risk of misallocating fees across products.
Dedicated profitability tools built for resellers and FBA sellers go further by combining real-time marketplace data with COGS tracking, returns allocation, and ad spend attribution in a single view. Resell-ready, for example, provides real-time ROI and net profit tracking per product, automated inventory P&L, and bulk price check tools designed specifically for Amazon FBA sellers who need SKU-level economics without building a custom model in Excel.
Business intelligence platforms (Tableau, Power BI, Looker) are the right choice when you need to combine data from multiple systems and build custom contribution margin models at scale. The setup cost is higher, but the output is a live dashboard that updates as new data flows in.
The common failure across all tools is false confidence. A spreadsheet can look precise while mixing confirmed numbers, estimates, and missing fields. Before trusting any output, verify that each cost field has a traceable source: an order record, a shipping invoice, an ad report, or a documented assumption.
Common challenges and limitations of the analysis
Data fragmentation. Revenue lives in your ecommerce platform. Fees live in marketplace settlement reports. Ad spend lives in Google Ads, Meta, or Amazon Advertising. Landed cost lives in your inventory system or a supplier spreadsheet. Pulling these into a single model requires either manual work or integrations that many businesses have not built.
Cost allocation judgment calls. Some costs are genuinely shared and cannot be cleanly attributed to a single SKU. How you allocate shared warehouse costs or blended carrier rates affects the output. Document your assumptions. If the methodology changes between periods, the results are not comparable.
Return rate volatility. Return rates shift seasonally, by channel, and in response to product changes. A return rate calculated over the last 30 days may not represent the next 90 days. Using a rolling average and building in a reserve reduces but does not eliminate this uncertainty.
Product interdependencies. Discontinuing a SKU based on its individual CM II can damage revenue if that product serves as an entry point for higher-margin purchases. The analysis needs to account for customer-product relationships, not just isolated product economics.
Accounting cost distortion. Standard accounting allocates overhead by volume or labor hours, which systematically overstates the cost of high-volume products and understates the cost of low-volume, complex ones. Using accounting product cost as a proxy for contribution margin produces pricing and portfolio decisions that are wrong in both directions.
Lag in data availability. Settlement reports, return data, and ad attribution reports often arrive with a delay. Real-time profitability views require either integrations that pull data automatically or a clear process for updating the model on a defined schedule.
How to act on what the analysis tells you
The output of a contribution margin analysis is a ranked portfolio. What you do with that ranking determines whether the work was worth doing.
Pareto analysis first. Identify which 20% of products generate 80% of total CM I. These are the products that fund everything else. They deserve priority in inventory investment, ad spend, and operational attention. Any decision that puts these products at risk needs to clear a high bar.
Volume-margin matrix. Plot products on two axes: sales volume and CM I ratio. This creates four quadrants. High volume, high margin: scale. High volume, low margin: reprice or reduce cost. Low volume, high margin: grow. Low volume, low margin: rationalize. The quadrant tells you the direction; the CM II calculation tells you the urgency.
Repricing before discontinuation. When a SKU has a genuine customer base and the margin gap is modest, a price increase is the right first move. A product running at 8% contribution margin because it is priced below the market may simply need a correction, not a discontinuation decision.
Bundling as a margin tool. Pairing a low-margin SKU with a high-margin one can improve blended economics per transaction. The bundle math needs to include discount depth, parcel weight changes, partial return handling, and inventory effects on both SKUs separately.
Portfolio rationalization as a cash flow lever. Cutting SKUs with negative CM II reduces complexity costs and frees working capital. The test is not whether revenue will drop — it will — but whether contribution dollars increase. A smaller catalog at a higher margin rate generates more cash than a larger one at a lower rate.
Track CM I ratio per SKU over time. Products in decline show falling ratios as volume drops and fixed costs spread over fewer units. This trend gives early warning of products approaching the exit threshold before they become a cash problem.
How often should you run this analysis
The honest answer is: more often than most businesses do it, and less often than the data changes.
Quarterly is the minimum cadence for a full contribution margin review across the portfolio. Costs shift, return rates move, and marketplace fees change. A model built in january can be materially wrong by april without updates.
Monthly is the right cadence for monitoring CM on your top SKUs, the products that generate the bulk of your contribution margin. Margin compression on these products is the earliest warning sign of a structural problem.
Weekly monitoring makes sense for high-velocity SKUs where ad spend, pricing, and return rates move quickly. A SKU profitable on one channel at 18% contribution margin can be losing money on another channel at negative 3% if fees and fulfillment costs differ. Weekly tracking catches this before it compounds.
Trigger-based reviews should happen whenever a material cost changes: a carrier rate increase, a new marketplace fee structure, a significant shift in return rates, or a change in sourcing cost. Waiting for the quarterly review when a fee change has already been in effect for two months means two months of margin erosion that could have been addressed sooner.
The first time you run the analysis, start with the products that represent 80% of revenue, typically the top 20–30% of the catalog. Then work through the long tail by category. The long tail often reveals that many SKUs collectively generate minimal margin while adding meaningful complexity cost, which makes the rationalization case easy to build.
Key Takeaways
Accurate product profitability analysis requires layered contribution margin calculations, not gross margin alone, because most SKUs are unprofitable once all variable and attributable fixed costs are properly allocated.
| Point | Details |
|---|---|
| Most SKUs lose money at full cost | Over 60% of SKUs were unprofitable once all variable costs were properly allocated. |
| CM I and CM II are both required | CM I shows variable margin; CM II reveals whether a product covers its dedicated fixed costs. |
| Top SKUs drive nearly all margin | A minority of SKUs generated the majority of total contribution margin in the same research. |
| Landed cost is routinely underestimated | Include freight, duties, port fees, and insurance — not just the supplier unit price. |
| Review cadence matters | Run full portfolio reviews quarterly; monitor top SKUs monthly; track high-velocity SKUs weekly. |